Grafana became the latest company to see its users face to face for the first time since Covid as it kicked off its first live conference in five years in Amsterdam today.
The company used the event to push out Grafana 11 to public preview, with GA expected May 14.
This includes Explore Metrics, a “query-less” experience for exploring Prometheus metrics, meaning users can drill down and interrogate metrics “without so much as seeing a PromQL query”.
Cofounder Torkel Ödegaard, talking through the latest rev of the flagship product, said, “This feature really addresses kind of the core mission of Grafana that we've had from the start, which is to make observability easy and powerful.”
But, Ödegaard pointed out “This feature is only for Prometheus metrics, which is a shame. It would be really cool to have something like this for logs as well.”
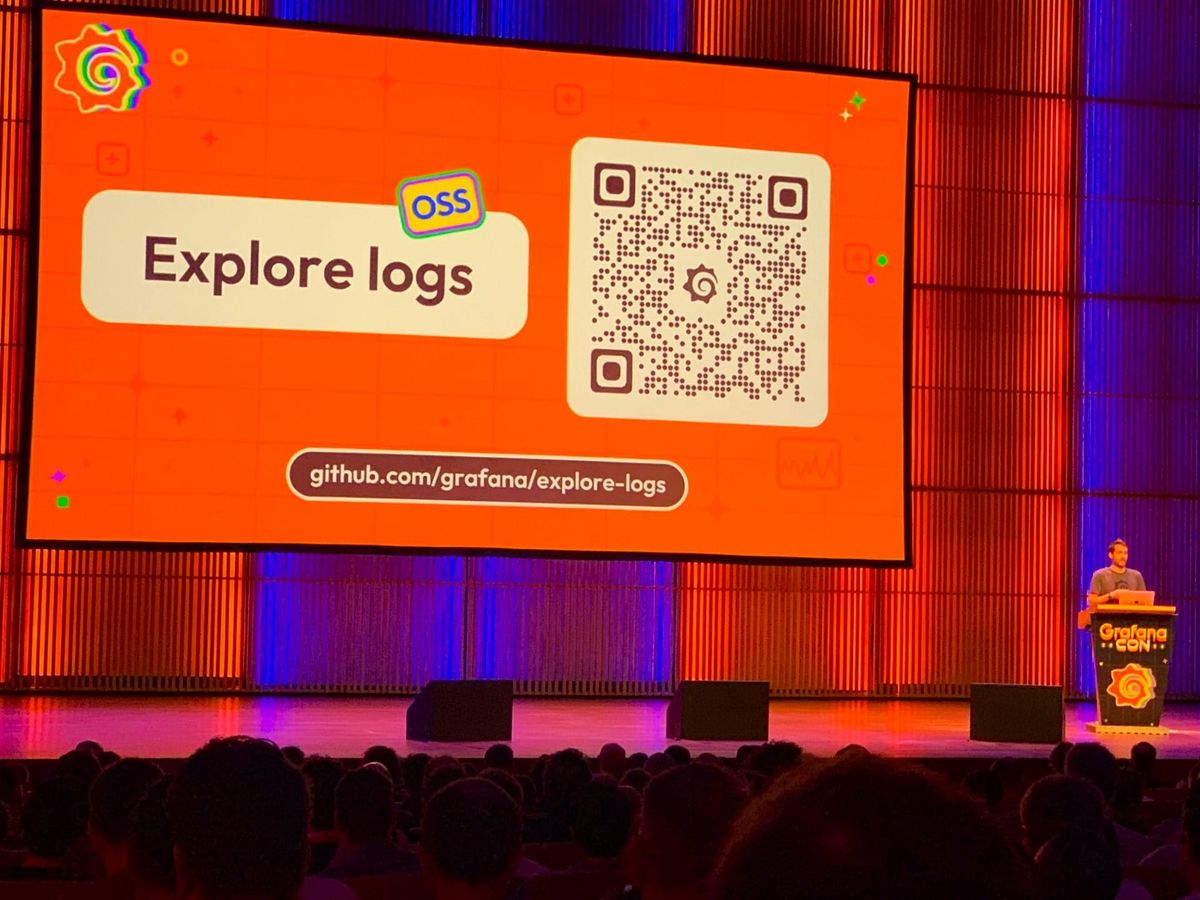
At which point he revealed that at a Grafana hackathon four weeks ago, the Loki team had produced Explore Logs, which offers the same patterns as the metrics tool, allowing users to explore services and volumes and access logs, without having to write queries. The technology is available in preview mode as an open source plug-in, but the company is not committing to a general availability date.
It also unwrapped version 3 of log platform Loki, adding bloom filters to accelerate queries, and native OpenTelemetry support.
Back to Grafana, and visualizations – which are kind of the point of Grafana – get improvements including an edit mode for the Scenes-based architecture introduced in Grafana 10, while the Canvas panel gets pan and zoom, snap and alignment, and easier interaction with the system being monitored.
See also: How a Platform Focus Helped Deutsche Bahn's Developers Cut Energy Consumption
New data sources include FalconLogScale, Looker, PagerDuty and SumoLogic, with more promised.
A new Grafana App Platform built on the core Grafana API gives “stronger integration points” for application developers.
Stephanie Hingtgen, senior software engineer at Grafana, said the move meant plugins will become “first party applications” within Grafana: “We'll allow plugins to access everything that core Grafana has access to, such as storage, authentication, and defining things beyond data sources and panels.”
In addition, she said, “These new applications will be able to interact with one another.”
Grafana also took the wraps of Alloy, which it says will increase the interoperability of Prometheus and OpenTelemetry – and of both with Grafana. It described it as “Grafana Labs’ distribution of the OpenTelemetry collector” and “100% OTLP compatible.”
Co-founder and CEO Raj Dutt used his stint on the stage to point out that the last time the company had staged the event in Amsterdam, in 2018, it had just 35 staff and barely a dozen customers. It now had over 1000 staff and five thousand customers, he said.
